Climate Change and Definition*
by
J. Ernest "Sunny" Breeding, Jr., PhD Geophysics
Introduction
Global warming is an important topic that is more and more in the news. Unfortunately, there is much confusion in the media, and therefore the public, about global warming. Some groups maintain that our planet is in imminent danger whereas others say there is no problem at all. So what should someone believe? The purpose in these pages is to give the view of the vast majority of climate scientists. A great deal has been learned in the last few decades through the use of new technology to make measurements and the analysis of these data. As a result, we have a much better idea about what is happening to our planet. This is a complicated research effort, and crosses many disciplines including, geology, geophysics, geochemistry, biology, oceanography, and meteorology.
In these pages I will give a definition of climate change, which is often misunderstood; explain the important difference between climate and weather; present evidence that our planet is warming, and at an increasing rate; describe how scientists collect climate data covering nearly the last million years and what we have learned; explain the highly chaotic nature of the last ice ages and what this means for the future; discuss the impact of the ice ages and climate change on our ancestors Cro-Magnons (also referred to as Modern Man); describe both the natural and man-made causes of climate change; explain how climate scientists can determine that humans are responsible for the current global warming; answer the question of how much of the present carbon dioxide in the atmosphere is due to humans burning fossil fuels; look at what global warming will mean for the future and why we need to prepare for it; and discuss what we have to do to mitigate global warming and why it is up to us to fix the Earth. My focus will be on the science and not issues such as "Cap and Trade," which are decisions made by politicians, and do not change the science.
I was fortunate to earn my PhD in geophysics at Columbia University and to study at the Lamont-Doherty Earth Observatory, an institute of the university. This is one of the leading centers for studies of the earth, including climate change. Because of this background I will from time to time highlight some of the great research being done at Columbia University. A video of the Lamont-Doherty Earth Observatory Programs is narrated by Tom Brokaw, and showcases the wide range of research being performed there.
Definition of Climate Change
There is a lot of confusion in the media and public about the terms climate and weather. They are not the same thing. Weather describes the meteorological conditions at a given time. To say that the temperature in New York City at noon will be 59 degrees Fahrenheit (15 degrees Centigrade) is an example of weather. Climate is weather averaged over a time interval. An example is the average annual temperature in London, England, which has been found to be 50.8 degrees Fahrenheit (10.4 degrees Centigrade) (climatemps.com). With weather you can make a prediction that a specific storm will occur at a given time citing parameters such as the expected temperature, humidity, and the percentage chances of rain. Climate theory cannot be used to predict the occurrence of a specific storm. We will learn later that the change in climate can be used to determine if storms, such as hurricanes, will on average be more or less intense when they occur in the future.
In considering the temperature of the Earth we are mainly interested in the global view rather than what happens at a specific location. Although day-to-day and year-to-year fluctuations can be interesting, our main interest is determining if there is any long-term trend occurring over many years. It is easier to deal with the change in temperature at each location rather than the actual temperatures. To determine the change in the global average surface temperature the earth is first divided into elemental areas. To illustrate we will use elemental areas that span 5 degrees of latitude and longitude. The average annual temperature is determined based on data for each elemental area for the years of interest. The change in the average annual temperature over a period of time such as a decade or longer is found for each elemental area. Then the global average is found of all of the elemental area temperature changes. As an example see the change in temperatures for elemental areas shown in Figure 1.1 for the years 1976 to 2000.
|
Fig. 1.1. Temperature trends by region. Red circles are positive values and indicate warming while blue circles are negative values and show cooling. No color represents no change. The size of the circles depicts the amount of increase or decrease with amounts from the smallest to the largest of .2, .4, .6, .8., and 1.0 degrees centigrade per decade, where 1 degree Centigrade equals 1.8 degrees Fahrenheit. (3rd IPCC) See References for the sources of figures. |

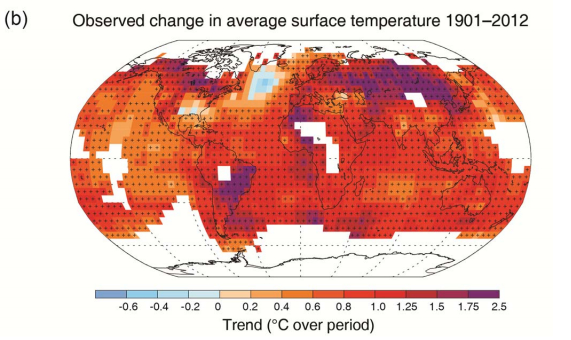
In an inspection of Figure 1.1 for the years 1976 to 2000 the most striking feature is that most of the elemental areas are red, i.e., the changes are positive. The climate change for the vast majority of the elemental areas spread over the earth is warming. Because of regional effects a few of the elemental areas are experiencing cooling. This is not unusual. But it should be obvious to everyone that the average of all of the values in Fig. 1.1 will be a positive number. It should be clear that our planet is experiencing global warming. When an analysis is made of data over a recent period of 100 years it is found that the global average surface temperature of the earth has increased by 1.4 degrees Fahrenheit (0.8 degrees Centigrade). That may not seem like much, but consider that the current global average surface temperature of the Earth is about 59 degrees Fahrenheit (15 degrees Centigrade). During the last ice age this value was about 48 degrees Fahrenheit (9 degrees Centigrade). The difference in the global average surface temperature between the last ice age and now is only about 11 degrees Fahrenheit (6 degrees Centigrade). This small change in temperature for such drastically different climates is why climate scientists worry about an increase in the global average surface temperature of 3.6 degrees Fahrenheit (2 degrees Centigrade). Such an increase will cause considerable damage to the Earth and the creatures that live on it. Another big worry is that of the increase in the global average surface temperature over the last century, as much as three-quarters of it occurred in the last 30 years (Hansen, 2009.) The rate of warming is increasing, and that is not good news. The global distribution in elemental area surface temperature changes from 1901 to 2012 is shown in Fig. 1.2. Note that some parts of the Earth have warmed a lot more than other parts.
|
Fig. 1.2. Global average surface warming in degrees Centigrade during the past century. Note that 1 degree Centigrade equals 1.8 degrees Fahrenheit. (5th IPCC) |
Understanding the Global Average Surface Temperature
Our usual experience in temperature changes is to consider what happens at a given location. It is not unusual at some locations and times of the year for the temperature to vary by as much or more than 40 degrees Fahrenheit (22 degrees Centigrade) in a 24-hour period. There can also be equally large differences when comparing temperatures at a given time between high latitude and tropical locations during the winter months. The variation in the global average surface temperature over time is much smaller, and it is important to remember this. A very small increase in the global average surface temperature can cause major damage to the Earth, as we will see in Page 2.
It has been noted that climate scientists are more interested in the long term trends rather than year-to-year variations in the global average surface temperature. This is not a new concept. For example, the same is true for investors in the stock market. Investors know that there will be both losses and gains from year-to-year in specific stocks and bonds. The important thing for a retirement fund is that over a 30- or 40-year period the trend is positive with an overall nice gain.
It is important to remember that the global average temperature is defined in terms of measurements at the surface of the Earth. This is a practical definition since the Earth's surface is where measurements are easily made, and we have years of global measurements of temperature that were made there. The definition has given us a good indication of the changing health of the Earth. But it should be realized that the warming of our planet also takes place in the lower atmosphere and at depths within the Earth, especially the oceans. In fact, a large percentage of the heating of the Earth takes place in the oceans. So we should not be surprised if the surface definition does not always give us a complete picture of the warming of the Earth. We will examine all of these concepts and more in the following pages.
There is an enormous amount of evidence that shows that the Earth is warming. We consider that next.
Pages
Page 1: Climate Change and Definition
Page 2: Evidence of Global Warming
Page
3: Measurements
Page 4: Ice Ages
Page 5: Causes of Climate Change
Page 6: Predicting the Future
Page 7: How Can We Fix Our Climate?
Page 8: References
*A slide show version of these pages on climate change is available for presentations to groups. See References for more details.
Copyright 2011-2015; For questions or comments contact the webmaster.